AiSara is better understood by watching this video. It is the same video in our front page. See next questions for more.
'Ai' stands for 'Artificial Intelligence'.
'Sara' is an acronym for 'Solution Approximation with Robust Algorithm'.
Sure.
Predictive Maintenance: Input data from your equipment, machinery, facility etc. and obtain data from sensors attached to them. Why? This allows the detection of wear and tear, scheduling just-in-time (JIT) maintenance to avoid costly repairs and expensive downtime.
Business Sales: Input data being customer, products, branch, services, marketing effort or in other words, who, what, when, where and how much. Output data being sales, revenue, profit. Why? Analyse and learn customer behavior, maximizing sales and serving your customers better. Anticipate the increase in demand or a changing trend. Know what you don't know yet.
Oil and Gas Subsurface Studies: Understand complex data from subsurface studies. Input data being rock properties such as permeability, fault transmissibility and other factors such as reservoir size. Output being the error or objective function of your study. See what influences the results the most and where the solution may lie, or where you need to look for it.
Medical: Understand patients' health data, and diagnose and predict accordingly.
Strategic analysis: Large companies or countries can run economic, political, and various scenarios.
Scientific and Research Development: Test impact of different parameters or combination of parameters on output.
The simplest way is to drag and drop your data within AiCentrica into AiSara.
In the future we will make APIs (Application Programme Interface) available.
The Z-axis is your result or output, e.g. profit, error, efficiency, etc.
AiSara can handle more than 3 dimensions, so you choose what you want to see in the X-axis and Y-axis.
The parameters are ranked on the right. You can see the impact on the right.
If you haven't seen the video in our main page, we encourage you to do that first.
What we hav done is taught computer how to see a pattern like a human does. It can see repeating patterns and know what is noise and what isn't. It can see what is important to the output and what is not. Humans can do much more of course such as contextual imformation, but what we have done is allow the computer to see how the parameters affect the results. Humans can only see 3 dimensions, but once we have taught the computer to see the pattern, it can do it in 3D, 5D, 10D or more. Lots of data application is complex, this allows for quick understanding which we may miss and it does the analysis in a short time frame.
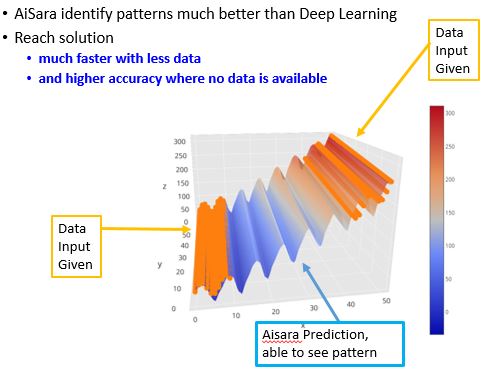
There is much comfort in being able to see how AiSara performs, you can compare the data visually with how Aisara sees the pattern near and away for the data.
When we can relate the input to the output quantitatively, we do not need to use equations, and for many use cases, there are no equations. That is why suddnely there is so many use cases.
The orange points below are data provided. The image below shows how AiSara is able to fill in the missing pattern.
We have been looking at some of the most complex and uncertain data in the world, the unseen aspects of Mother Nature thousands of feet below ground. We are from the oil and gas industry. We have to make sense of what is down there just by looking at bits and pieces of data at the surface. We have been doing this for more than 20 years and developed deep intuitive understanding on data complexity and relationship between input and output. Often, we can see the output by looking at the input without doing complex calculations and vice versa, reverse engineering how the reservoir looks like by looking at the output.
The creation is driven by our needs to solve the problem in oil and gas but we find that the technology can be applied to many sector/industry.
Essentially, deep learning uses linear algebra arrays/matrices/tensors to numerically relate input data to the output. There is more to deep learning than this but we try to keep it simple here. You can pull apart the tensor and scratch your head to understand what it means, (which parameters are important and how it affects the output) but in many cases it is not practical or actually impossible.
With AiSara you can literally see the solution space. You can compare the actual data to the solution provided by AiSara and judge the accuracy of AiSara for yourself.
We welcome you to try!
The prototype is as seen in the video in the homepage. We are adding features and trying to give the user the best experience possible. The beta version is expected to be released sometime in 2019.
There will be a free public version allowing use of 4 variables. More information will follow. Stay tuned. Please subscribe to get latest info.
We are located in the heart of Kuala Lumpur, Malaysia. We welcome further enquiry at enquiry@aicentrica.com
Definitely. By complementing your app with AiSara, you are stretching the limitations of your app, unlocking endless possibilities.
You can contact us at enquiry@aicentrica.com
AiSara is for analysts, engineers, researchers, consultants, students, educators and all professionals from different disciplines.
In addition to AiSara, we are planning many more toolkits to be housed in the future for different disciplines. We are also working on smartbots (for IoT, or scheduled analysis).
No, we are using our proprietary pattern recognition technology. The reason being we need a technology that allow us to display all the solution space, local minimas, local maximas. We need a technology that is interperetable, explainable. Say for example, I can visualize where the data is and how good the solution is compared to the data, and how the different varibales impact the result.
You may be referring to the plotting capability of MATLAB. What you are seeing with AiSara is teh ability to recognize pattern even with 10 different variables or more.